<< Hide Menu
Dalia Savy
Jeremy Kiggundu
Dalia Savy
Jeremy Kiggundu
Understanding the structure of an atom is essential to comprehending the photoelectric effect and interpreting photoelectron spectroscopy. Remember that an atom is made up of three subatomic particles:
- Protons - located in the nucleus with a +1 charge and a mass of approximately 1 amu.
- Neutrons - located in the nucleus with no charge and a mass of approximately 1 amu.
- Electrons - found around the nucleus in orbitals with a charge of -1 and no mass. The movement of electrons will be our focus in this study guide. Be sure to review how to write out the electron configuration of an atom and understand that electrons are not only found in different energy levels or shells but are also located in different subshells:
- When writing out electron configuration, the number (1, 2, 3, etc) represents the principle energy level or electron shell.
- Following the electron shell, you will letters (s, p, d, and f). These letters represent the four unique subshells where electrons can be located. The maximum number of electrons in each subshell, respectively, is 2, 6, 10, and 14. The following is the electron configuration of boron, element 5 on the periodic table:

The Quantum-Mechanical Model
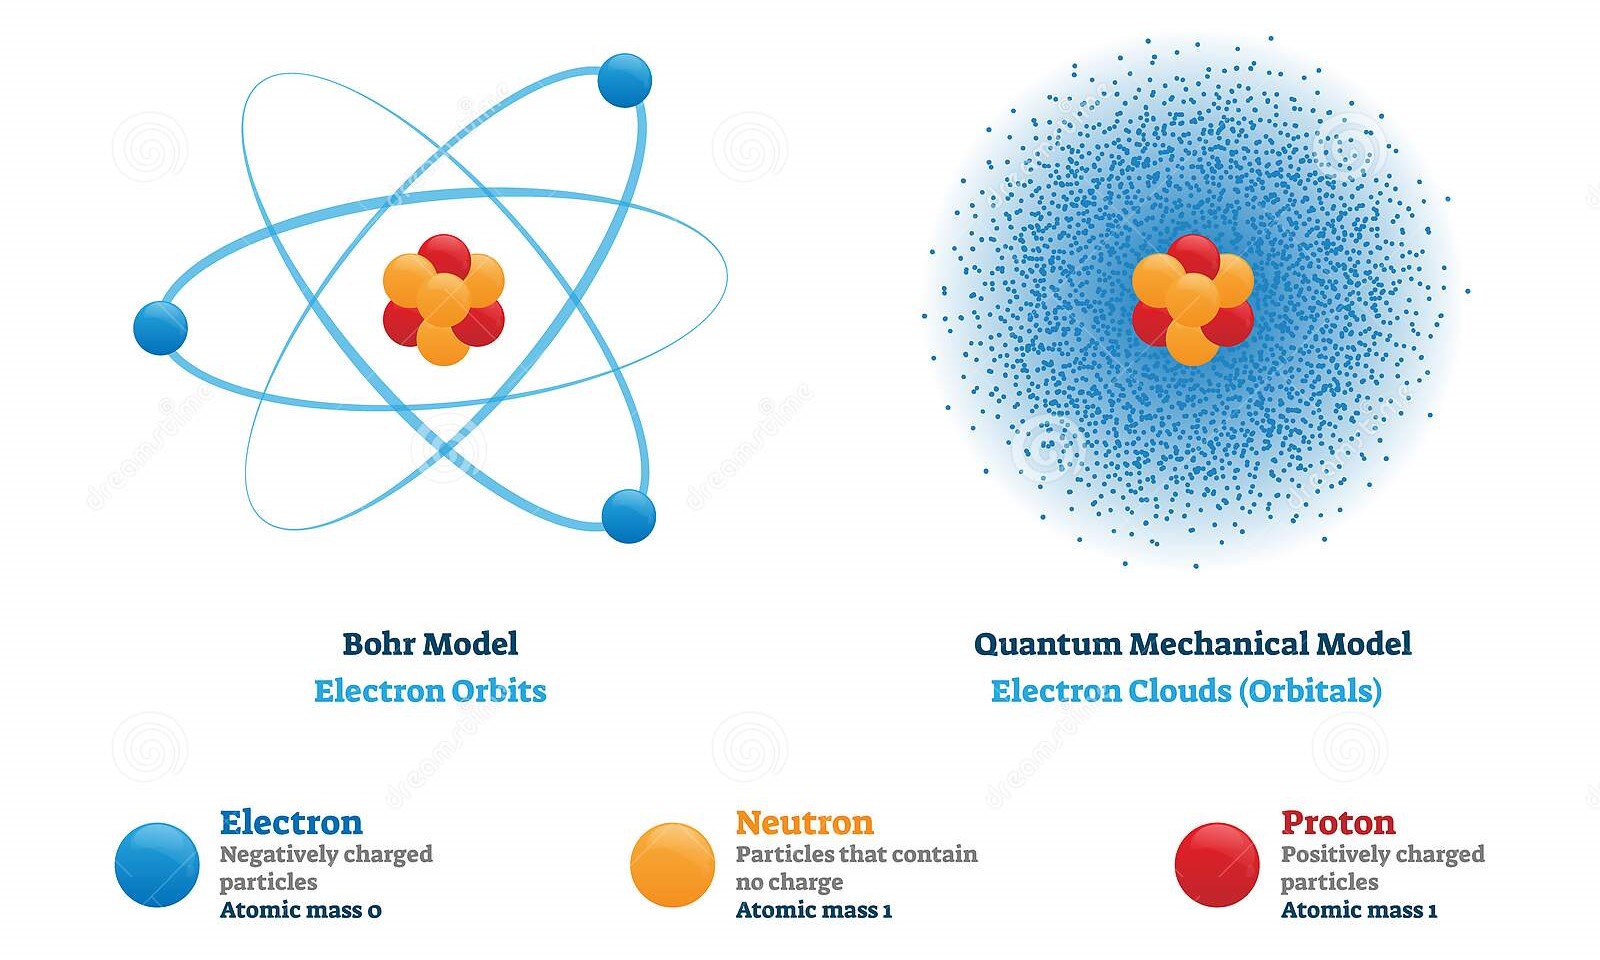
Before this section, we have been discussing the atom with regard to Bohr's model. However, today chemists use the quantum-mechanical model of an atom to more accurately display how electrons behave. Rather than precisely defining where electrons may exist around a nucleus, the quantum-mechanical model displays how electrons have the probability of existing almost anywhere.

Image Courtesy of dreamstime
Although you don't have to know this for the AP exam, it may help your understanding of this section. The biggest takeaway of the quantum-mechanical model is Heisenberg's uncertainty principle, which basically states that it is virtually impossible to know both the exact position and momentum of a particle at the same time.
👉 For more information about this topic (if you're interested), check out this site.
The Properties of Light 🌈
Before we continue our exploration of electrons, we have to understand the properties of light. Light has many properties in common with electrons, such as its wave-particle duality. Electrons and light exist as both a particle and a wave simultaneously. An electron's wave-like properties are basically the reason for Heisenberg's uncertainty principle.
Light as Particle
Let's focus on light as a particle, otherwise known as a photon! Albert Einstein proposed that light is made up of photons, each of which has a specific energy.
Frequency of Light ⚡
Frequency (v) represents the number of waves that pass a point in space in one second. You can think about the frequency of light as the number of times a slinky goes back and forth in a second.
The frequency of light is also related to its energy in a direct relationship. Light with a higher frequency has more energy than light with a lower frequency.
The Photoelectric Effect
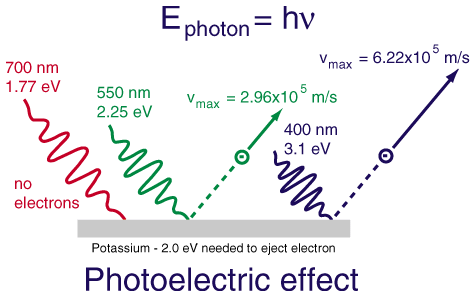
The photoelectric effect demonstrates that when a photon of sufficient energy hits a metal surface, it can emit an electron. In other words, electrons are emitted from a metal surface when light strikes it if its frequency is high enough. ✨
Basically, the photoelectric effect only occurs if the frequency of light reaches a certain threshold:
- If the frequency is low, the metal absorbs the light. It is not high enough to reach the threshold and therefore does not exhibit the photoelectric effect.
- If the frequency is high enough and reaches the threshold, a specified number of electrons are ejected from the metal.

Image Courtesy of Google; you can see here that only photons that reach the given threshold of -2.0 eV can eject an electron from this metal, potassium.
We'll go over this concept in greater depth in unit three of the AP Chemistry curriculum.
Photoelectron Spectroscopy (PES)
Photoelectron spectroscopy (PES) is a technique used to compare the relative energies of atoms, ions, and molecules. PES uses energy from electrons emitted through the photoelectric effect to provide insight into the electronic configuration of a sample.
How does PES work?
When light of a certain frequency shines upon a sample, a limited number of electrons are emitted. The released energy reflects the energy or energy levels within an atom.
In viewing the photoelectron spectrum of an element, you are also able to:
- Distinguish the different orbital levels in an atom
- Determine the electron configuration of an atom. Each peak in a photoelectron spectrum represents a different orbital level where electrons can be found.
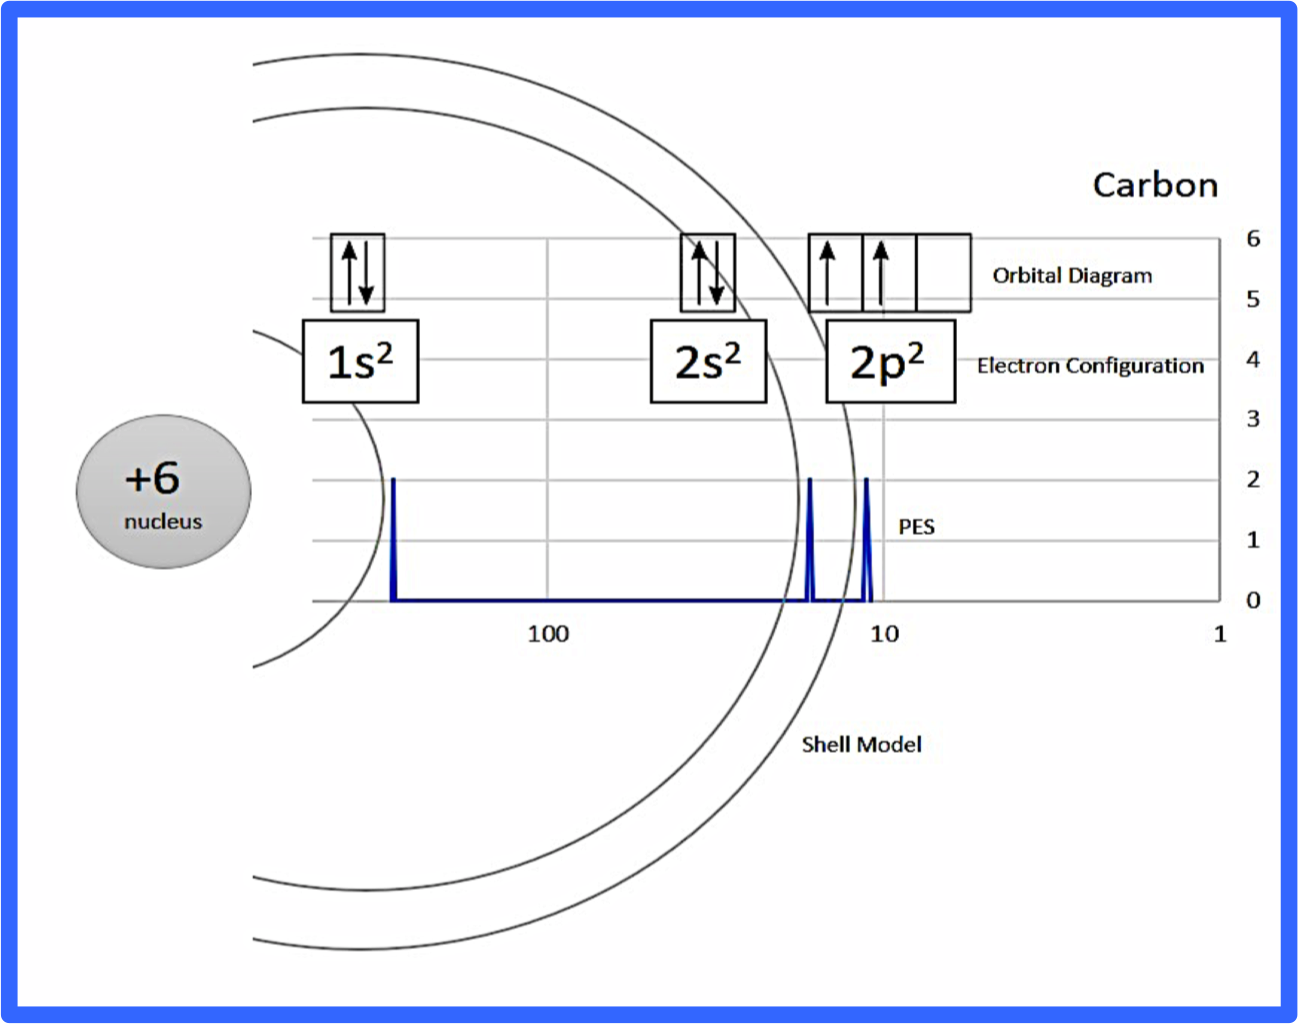
Here is a diagram putting all of these concepts together, but don't worry, we'll break it down further! 🎉

Image Courtesy of Chemdx
Interpreting a Photoelectron Spectrum
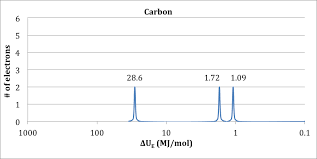
Here is a photoelectron spectrum of carbon without the markups which is how the AP exam would give you a graph like this. Let's dissect it.

Image Courtesy of Chemmybear
The Axes of a PES
First, let's look at the axes. When looking at a graph for the first time, the first thing you want to look at is what the graph is representing.
The x-axis is the binding energy, which is used very similarly to the term "ionization energy" on the AP Chemistry exam. We'll go over ionization energy in the next study guide, but for now, think of it as the amount of energy required to remove an electron from an atom.
The closer an electron is to the nucleus of an atom, the more energy will be required to remove it. Therefore, the binding energy, or ionization energy, will be higher as well. Think about this with regard to the fact that positive charges attract negative charges. The super-positive nucleus is going to be strongly attracted to the negative electrons around it. Electrons that are closer to the nucleus are thus more strongly attracted to it.
This information should be able to tell us which side the nucleus is on in this diagram. With this photoelectron spectrum of carbon, it is on the left side because the binding energy is greatest there (1000>0.1). So let's read the diagram from left to right.
The y-axis of this graph simply tells you how many electrons there are in each peak.
The Peaks on a PES
Since peaks represent an orbital where electrons can be found, the first orbital (closest to the nucleus) must be 1s. Because the graph goes up to 2 on the y-axis, there are 2 electrons in the 1s orbital. This should make sense because there is a maximum of two electrons in the s suborbital.
The next orbital has to be 2s and the PES indicates there are 2 electrons in this orbital as well.
So far, the electron configuration seems to be 1s^2 2s^2.
There is one more peak though, which corresponds to the 2p orbital. However, this orbital isn't filled to maximum capacity, there are only 2 electrons in it.
The full electron configuration of this element is 1s^2 2s^2 2p^2. If I didn't tell you that this PES was for carbon, you should be able to guess it given the graph and the periodic table.
Big Ideas with Photoelectron Spectroscopy
When breaking down a PES,
- The position of the peak indicates how much energy is required to remove an electron from that sublevel.
- The height of the peak indicates how many electrons occupy that sublevel.
Practice MCQs
The next two questions are adapted from a Quizizz that kkehesci created.
- Refer to the photoelectron spectrum of neon shown below to answer the following question. Which of the following statements best accounts for peak A being to the left of peaks B and C?
a. The electron configuration of neon is 1s^2 2s^2 2p^6.
b. Neon has 8 electrons located in its valence shell.
c. Core electrons of an atom experience a much greater attraction to the nucleus than valence electrons.
d. Peaks B and C show 1st ionization energies (I.E.) in neon, whereas peak A shows the 2nd I.E. of Neon.
2. Which peak shows electrons closest to the nucleus? A, B, C, or D?
Answers to MCQs
- The answer to #1 is C: core electrons of an atom experience a much greater attraction to the nucleus than valence electrons. This goes back to the concept that electrons closest to the nucleus have a higher ionization energy/binding energy.
- The answer to #2 is peak A. This goes back to that same exact concept. If asked about which peak corresponds to the energies of the valence electrons, you should say peak D (since they are furthest from the nucleus).
AP Practice Question - 2019 #5
This question is taken from the AP Chemistry Exam in 2019.
In part a, they are asking you to simply write the electron configuration and identify the element. We just did this a few times! If you feel comfortable with this, try it on your own first before looking at the answer.
Since the binding energy is the largest on the left, the peak on the left is the 1s orbital. The electron configuration is:
You could use the noble gas shortcut here as well, but I often leave the electron configuration like this when given a PES. You may make a mistake when trying to write out the noble gas shortcut with a photoelectron spectrum.
To identify the element, just pull out your periodic table! You should get Ca.
🎥 Watch Jacob Jeffries explain the parts of the atom and the experiments scientists use to study them.

© 2024 Fiveable Inc. All rights reserved.