<< Hide Menu
Sadiyya Holsey
Dalia Savy
Sadiyya Holsey
Dalia Savy
Types of Statistics
Descriptive statistics involves the use of numerical data to measure and describe the characteristics of groups, and this includes measures of central tendency and variation. We'll be focusing on descriptive statistics in this study guide! It does not involve making inferences about a population based on sample data.
Inferential statistics, on the other hand, involves using statistical methods to make inferences about a population based on data. It allows you to draw conclusions about a population based on the characteristics of a sample. Specifically, it provides a way to see validity drawn from the results of the experiment🧪🔬.
Therefore, descriptive statistics describe the data, while inferential statistics tell us what the data means.
Summarizing Data
When one has a ton of data, how do they begin to go through it? Typically, a researcher would construct and interpret a graph with their data, and they use descriptive statistics to do so. 📈
Measures of Central Tendency
Measures of central tendency are statistical values that represent the center or typical value of a dataset. The three most commonly used measures of central tendency are the mean, median, and mode.
- The mean is the average of a set of scores. You can calculate the mean by summing all of the values in a dataset and dividing by the total number of values. The mean is sensitive to outliers, or unusually large or small values, and can be affected by them.
- The median is the middle score of distribution, separating the higher half of the data from the lower half. The median is not affected by outliers and can be a better measure of central tendency when the dataset contains outliers.
- The mode is the most frequently recurring score in a dataset. A dataset can have one mode, more than one mode, or no mode. If two scores appear the most frequently, the distribution is bimodal. If three or more scores appear most frequently, the distribution is multimodal. Let's practice calculating the three measures of central tendency, mean, median, and mode, using the following data set: 5, 10, 5, 7, 12, 15, 18
The easiest to spot is the mode: which value, if any, appears more often than others? Here, we can see 5 twice, so the mode of this dataset is 5.
Then, you may want to calculate the mean by adding all of these data values and dividing by the total. Since we have seven values, we have to divide by seven: (5 + 10 + 5 + 7 + 12 + 15 + 18)/7 = 10.286
The median is the middle of the data set when the numbers are in order. Make sure you always put them in order!! If you do so here, you will find that the median is 10.
Measures of Variation
Measures of variation describe how spread out or dispersed the values in a dataset are. The most commonly used measure of variation is the standard deviation, which is a measure of how much the values in a dataset deviate from the mean. It is basically used to assess how far the values are spread below and above the mean. A dataset with a low standard deviation has values that are relatively close to the mean, while a dataset with a high standard deviation has values that are more spread out.
Another, less complex, measure of variation you should be familiar with for this course is the range of a dataset. Range is just the difference between the highest and lowest values in the dataset.
Correlation
The correlation coefficient is a statistical measure that describes the strength and direction of the relationship between two variables. It can range from -1 to 1. A value of -1 indicates a strong negative relationship, a value of 1 indicates a strong positive relationship, and a value of 0 indicates no relationship.
You can simply think of it as a measure of how well two variables are correlated, and the closer it is to -1 or +1, the stronger the correlation.
Positive Correlation
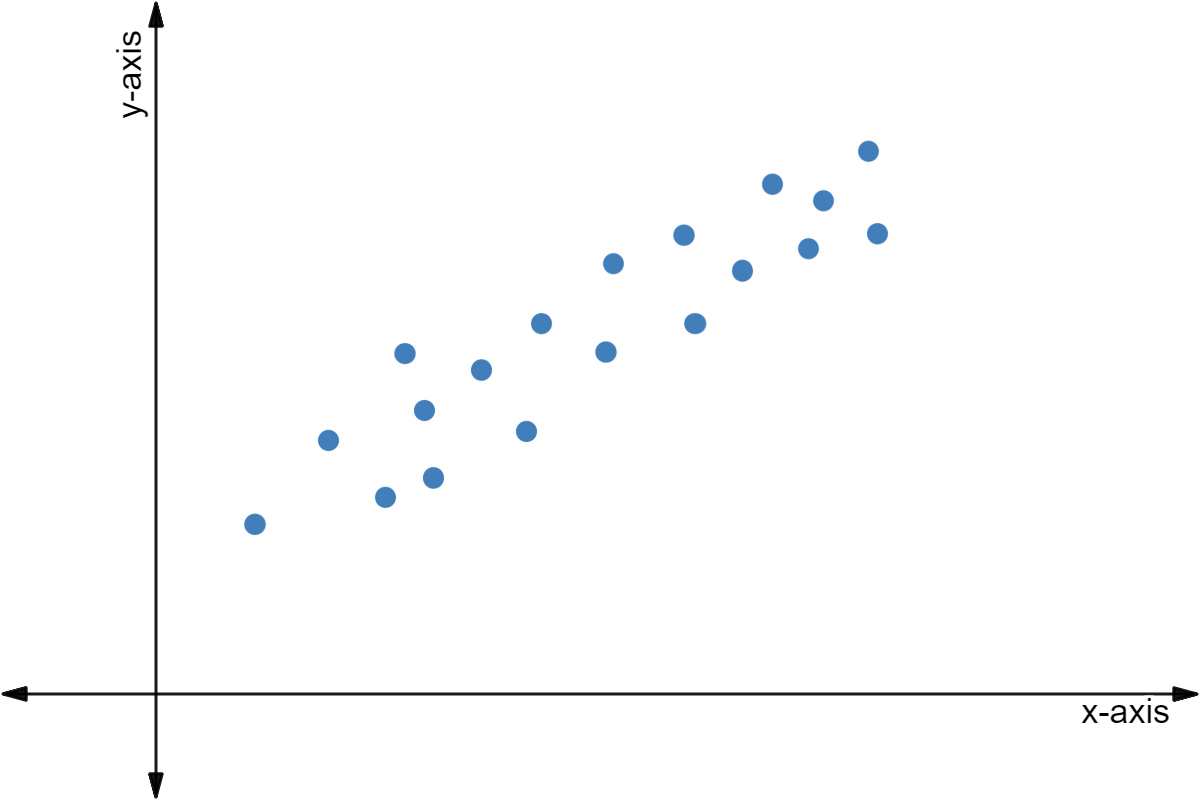
Positive correlation shows that as one variable increases ⬆️, the other variable increases ⬆️. For example, a positively correlated group may show that as height increases, weight increases as well.

Image courtesy of Expii
Negative Correlation
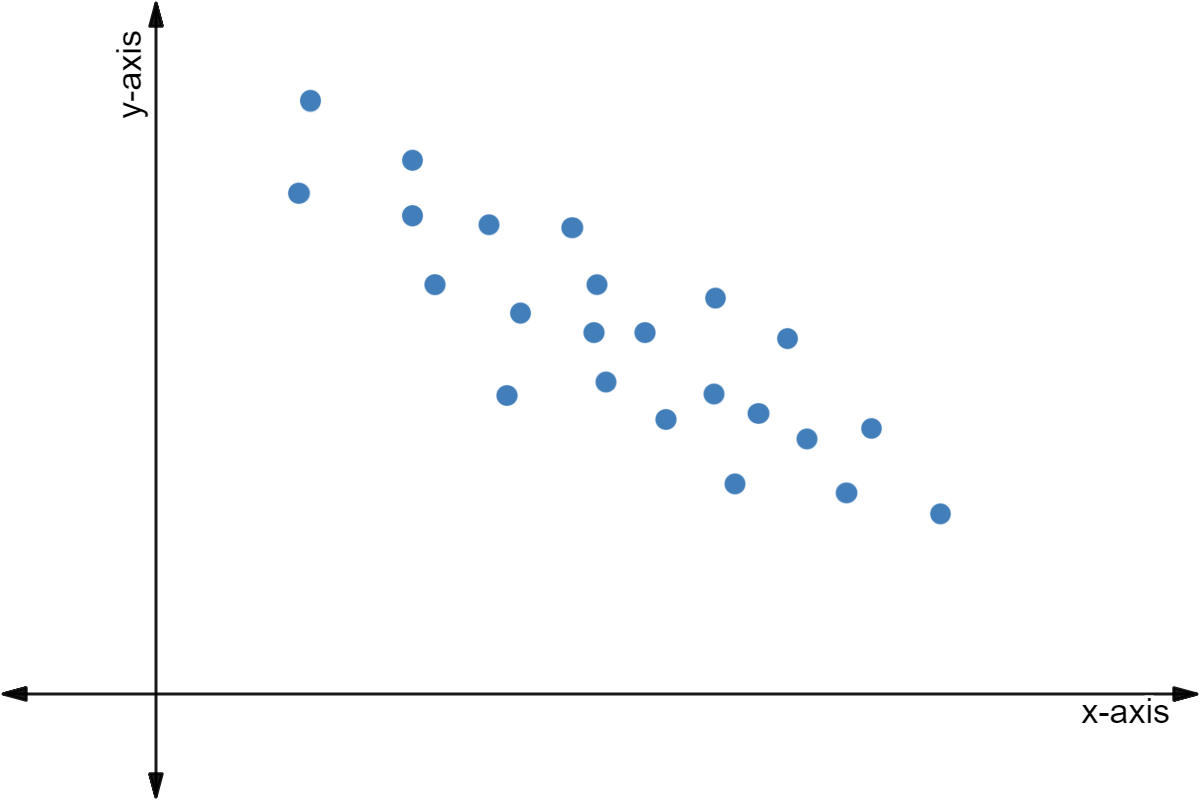
Negative correlation shows that as one variable increases ⬆️, the other decreases ⬇️. An example of a negative correlation could be how as the number of hours of sleep increases, tiredness decreases.

Image courtesy of Expii
No Correlation
No correlation shows that there is no connection between the two variables. An example of no correlation could be IQ and how many pairs of pants an individual owns.

Image courtesy of Expii.
Remember, correlation does not imply causation, even if the correlation coefficient is -1 or +1. You must run an experiment to prove there is causation.
Skews
A frequency distribution is a breakdown of how the scores fall into different categories or ranges. There are several types of frequency distributions:
- 🔔A normal distribution is a bell-shaped frequency distribution that is symmetrical about the mean. We'll delve into this deeper, but graph (b) on the image below shows a normal distribution!
- 2️⃣A bimodal distribution is a frequency distribution with two peaks. This occurs when the dataset has two distinct groups of values that occur with different frequencies.
- 👍A positively skewed distribution has a tail extending to the right (towards larger values). This occurs when the dataset has a few unusually large values that pull the mean to the right. Graph (a) in the image below is a positively skewed distribution, where the mean is greater than the median.
- 👎A negatively skewed distribution has a tail extending to the left (towards smaller values). This occurs when the dataset has a few unusually small values that pull the mean to the left. Graph (c) in the image below is a negatively skewed distribution, where the median is greater than the mean. It might be hard to remember which way the skew is. If the tail on the right is longer like it is in (a), then it's a skew to the right. If the tail on the left is longer like it is in (c), then it's a skew to the left.

Image courtesy of ResearchGate
Normal Distributions
The normal curve, or (b) in the above image, is the only one you have to really be familiar with for this course. There are two important values that you should memorize: 68% and 95%.
Image from Myers' AP Psychology Textbook; 2nd Edition
This is a normal curve that includes data about intelligence📖. Basically, 68% of the data falls within one standard deviation of the mean. Here, one standard deviation is equivalent to 15, so the data falls between 85 and 115, or +- 15 points of 100.
95% of the data falls within two standard deviations of the mean. Since 2 standard deviations are equal to 30, the data falls between 70 and 130, or +-30 points of 100.
Another term that you should be somewhat familiar with is statistical significance, or the likelihood that something occurs by chance😲. If something is statistically significance, it did not occur by chance (some outside factor influenced the data). If something isn't statistically significant, it occurred completely by chance. To determine this, you would compare the mean of the control group and the mean of the experimental group.
Practice AP FRQ
The following question is taken from the College Board website (2017 AP Exam - Part B of #1).
A study was conducted to investigate the role of framing on concern for healthy eating🍏. Each participant (N = 100) was randomly assigned to one of the two conditions. In the first condition, the participants read an article indicating that obesity is a disease🦠. Participants in the second condition read an article indicating that obesity is the result of personal behaviors and decisions.
Participants were asked to indicate how important it would be for them to eat a healthy diet. Scores ranged from 1 (not very important) to 9 (very important). The results are presented in the table below.
| Group | Mean Score - Concern for Healthy Eating | Standard Deviation |
| Disease | 3.4 | 1.4 |
| Behavior | 6.1 | 1.2 |
Table Courtesy of College Board
- Operationally define the dependent variable.
- What makes the study experimental rather than correlational?
- What is the most appropriate conclusion the researchers can draw about the relationship between the variables in the study? The scoring guidelines provide the rubric for this question. You should be able to answer all three parts. If not, just go through this unit’s guides one more time and you’ll nail this FRQ.

© 2024 Fiveable Inc. All rights reserved.